Pipeline Metrics
This page shows you how to export metrics from a Kubeflow Pipelines component. For details about how to build a component, see the guide to building your own component.
Overview of metrics
Kubeflow Pipelines supports the export of scalar metrics. You can write a list of metrics to a local file to describe the performance of the model. The pipeline agent uploads the local file as your run-time metrics. You can view the uploaded metrics as a visualization in the Runs page for a particular experiment in the Kubeflow Pipelines UI.
Export the metrics file
To enable metrics, your program must write out a file named
/mlpipeline-metrics.json. For example:
  accuracy = accuracy_score(df['target'], df['predicted'])
  metrics = {
    'metrics': [{
      'name': 'accuracy-score', # The name of the metric. Visualized as the column name in the runs table.
      'numberValue':  accuracy, # The value of the metric. Must be a numeric value.
      'format': "PERCENTAGE",   # The optional format of the metric. Supported values are "RAW" (displayed in raw format) and "PERCENTAGE" (displayed in percentage format).
    }]
  }
  with file_io.FileIO('/mlpipeline-metrics.json', 'w') as f:
    json.dump(metrics, f)
See the full example.
The metrics file has the following requirements:
- The file path must be
/mlpipeline-metrics.json. namemust follow the pattern^[a-z]([-a-z0-9]{0,62}[a-z0-9])?$.numberValuemust be a numeric value.formatcan only bePERCENTAGE,RAW, or not set.
View the metrics
To see a visualization of the metrics:
- Open the Experiments page in the Kubeflow Pipelines UI.
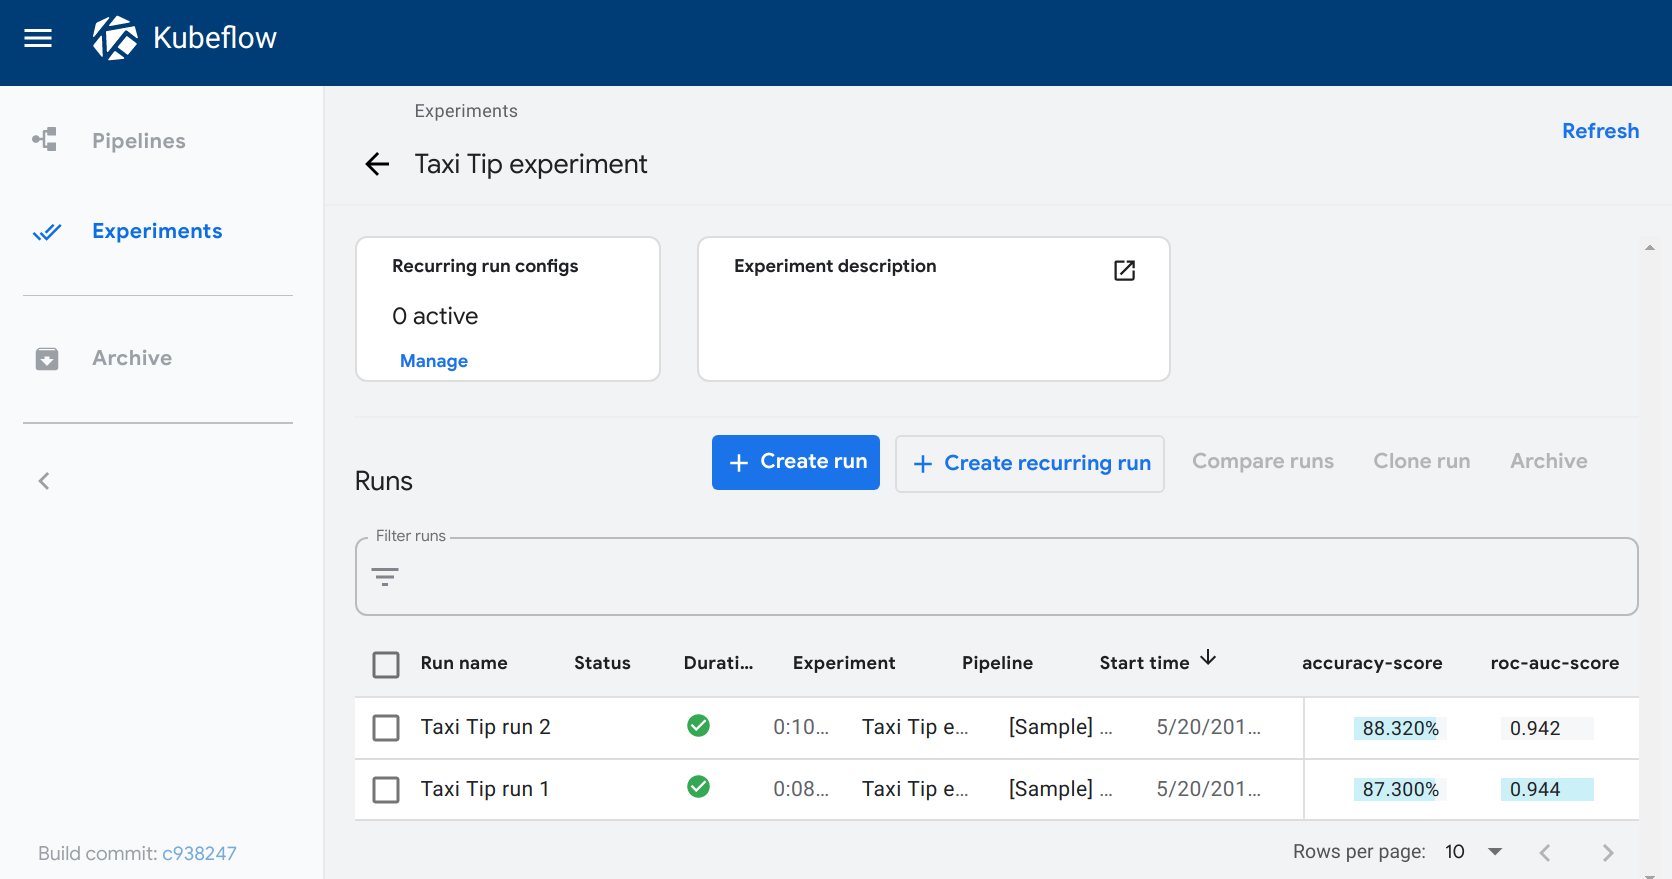
- Click one of your experiments. The Runs page opens showing the top two metrics, where top is determined by prevalence (that is, the metrics with the highest count) and then by metric name. The metrics appear as columns for each run.
The following example shows the accuracy-score and roc-auc-score metrics for two runs within an experiment:
Next step
Visualize the output of your component by writing out metadata for an output viewer.
Feedback
Was this page helpful?
Glad to hear it! Please tell us how we can improve.
Sorry to hear that. Please tell us how we can improve.