Metadata
Beta
This Kubeflow component has beta status. See the Kubeflow versioning policies. The Kubeflow team is interested in your feedback about the usability of the feature.The goal of the Metadata project is to help Kubeflow users understand and manage their machine learning (ML) workflows by tracking and managing the metadata that the workflows produce.
In this context, metadata means information about executions (runs), models, datasets, and other artifacts. Artifacts are the files and objects that form the inputs and outputs of the components in your ML workflow.
Installing the Metadata component
Kubeflow v0.6.1 and later versions install the Metadata component by default. You can skip this section if you are running Kubeflow v0.6.1 or later.
If you want to install the latest version of the Metadata component or to install the component as an application in your Kubernetes cluster, follow these steps:
-
Download the Kubeflow manifests repository:
git clone https://github.com/kubeflow/manifests -
Run the following commands to deploy the services of the Metadata component:
cd manifests/metadata
kustomize build overlays/db | kubectl apply -n kubeflow -f -
Using the Metadata SDK to record metadata
The Metadata project publishes a Python SDK (API reference, source) that you can use to record your metadata.
Run the following command to install the Metadata SDK:
pip install kubeflow-metadata
Try the Metadata SDK in a sample Jupyter notebook
You can find an example of how to use the Metadata SDK in this
demo notebook.
To run the notebook in your Kubeflow cluster:
- Follow the guide to setting up your Jupyter notebooks in Kubeflow.
- Go to the
demonotebook on GitHub. - Download the notebook code by opening the Raw view of the file, then
right-clicking on the content and saving the file locally as
demo.ipynb. - Go back to your Jupyter notebook server in the Kubeflow UI. (If you’ve moved away from the notebooks section in Kubeflow, click Notebook Servers in the left-hand navigation panel to get back there.)
- In the Jupyter notebook UI, click Upload and follow the prompts to upload
the
demo.ipynbnotebook. - Click the notebook name (
demo.ipynb) to open the notebook in your Kubeflow cluster. - Run the steps in the notebook to install and use the Metadata SDK.
When you have finished running through the steps in the demo.ipynb notebook,
you can view the resulting metadata on the Kubeflow UI:
- Click Artifact Store in the left-hand navigation panel on the Kubeflow UI.
- On the Artifacts screen you should see the following items:
-
A model metadata item with the name MNIST.
-
A metrics metadata item with the name MNIST-evaluation.
-
A dataset metadata item with the name mytable-dump.
You can click the name of each item to view the details. See the section below about the Metadata UI for more details.
Learn more about the Metadata SDK
The Metadata SDK includes the following predefined types that you can use to describe your ML workflows:
DataSetto capture metadata for a dataset that forms the input into or the output of a component in your workflow.Executionto capture metadata for an execution (run) of your ML workflow.Metricsto capture metadata for the metrics used to evaluate an ML model.Modelto capture metadata for an ML model that your workflow produces.
Using metadata watcher to record metadata
Besides using the Python SDK to log metadata directly, you can add your own metadata watcher to watch Kubernetes resource changes and save the metadata into the metadata service.
Tracking artifacts on the Metadata UI
You can view a list of logged artifacts and the details of each individual artifact in the Artifact Store on the Kubeflow UI.
-
Go to Kubeflow in your browser. (If you haven’t yet opened the Kubeflow UI, find out how to access the central dashboard.)
-
Click Artifact Store in the left-hand navigation panel:
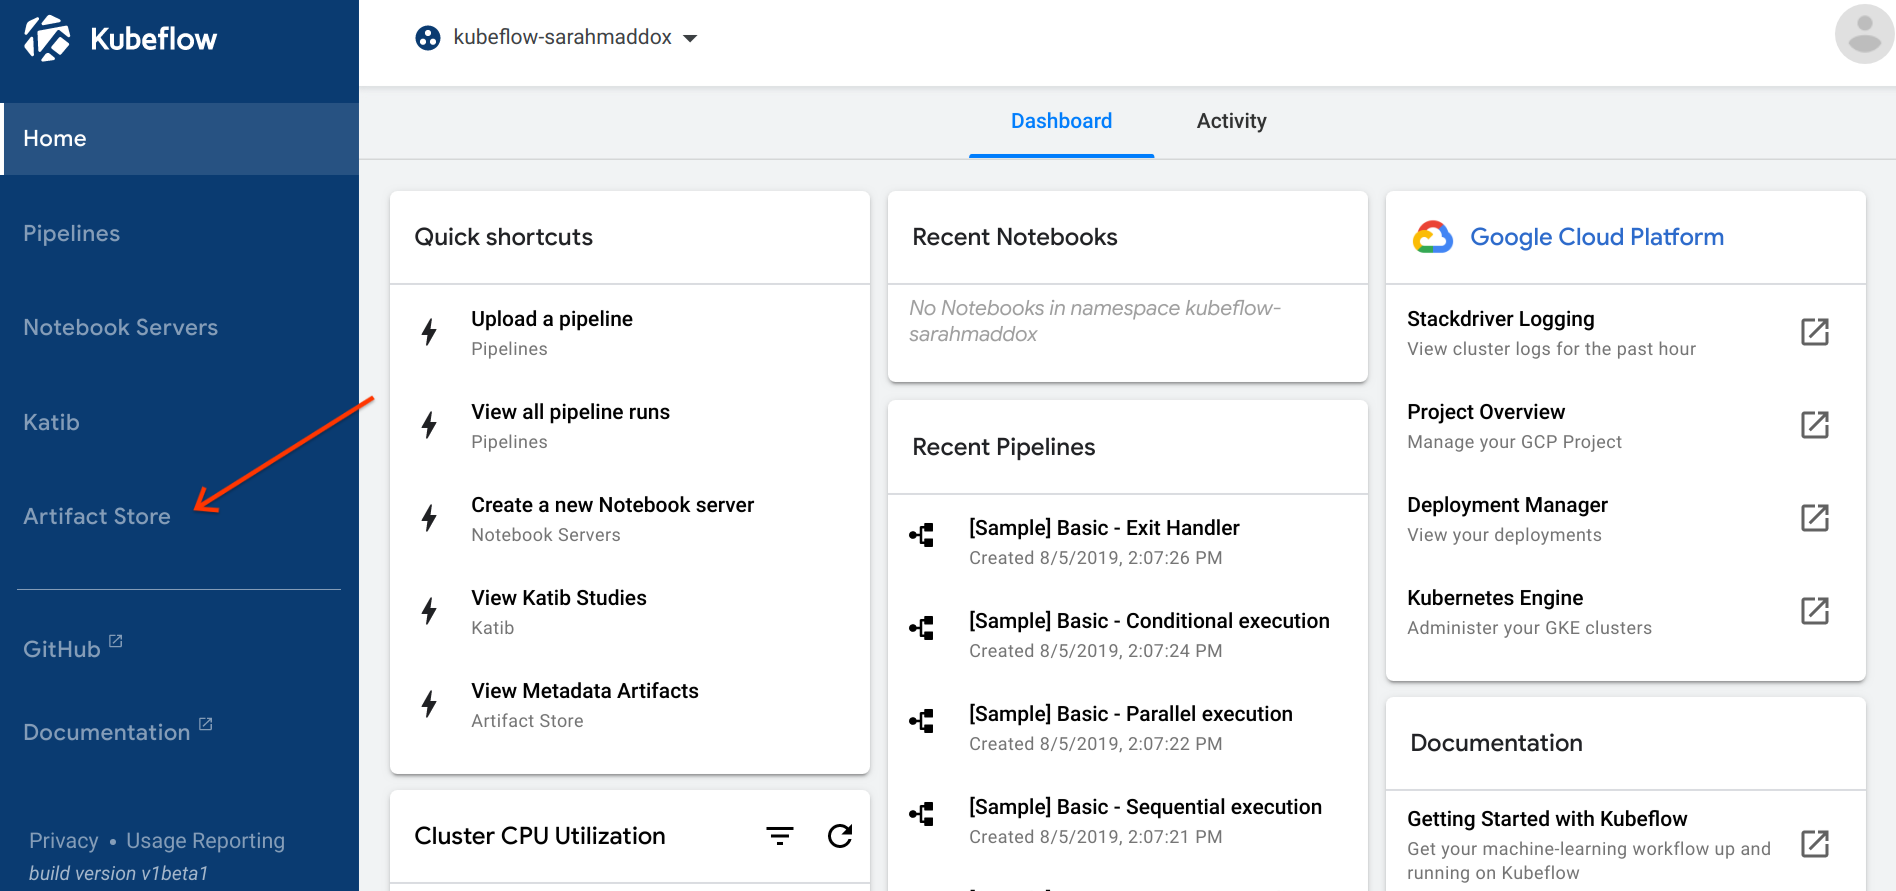
-
The Artifacts screen opens and displays a list of items for all the metadata events that your workflows have logged. You can click the name of each item to view the details.
The following examples show the items that appear when you run the
demo.ipynbnotebook described above: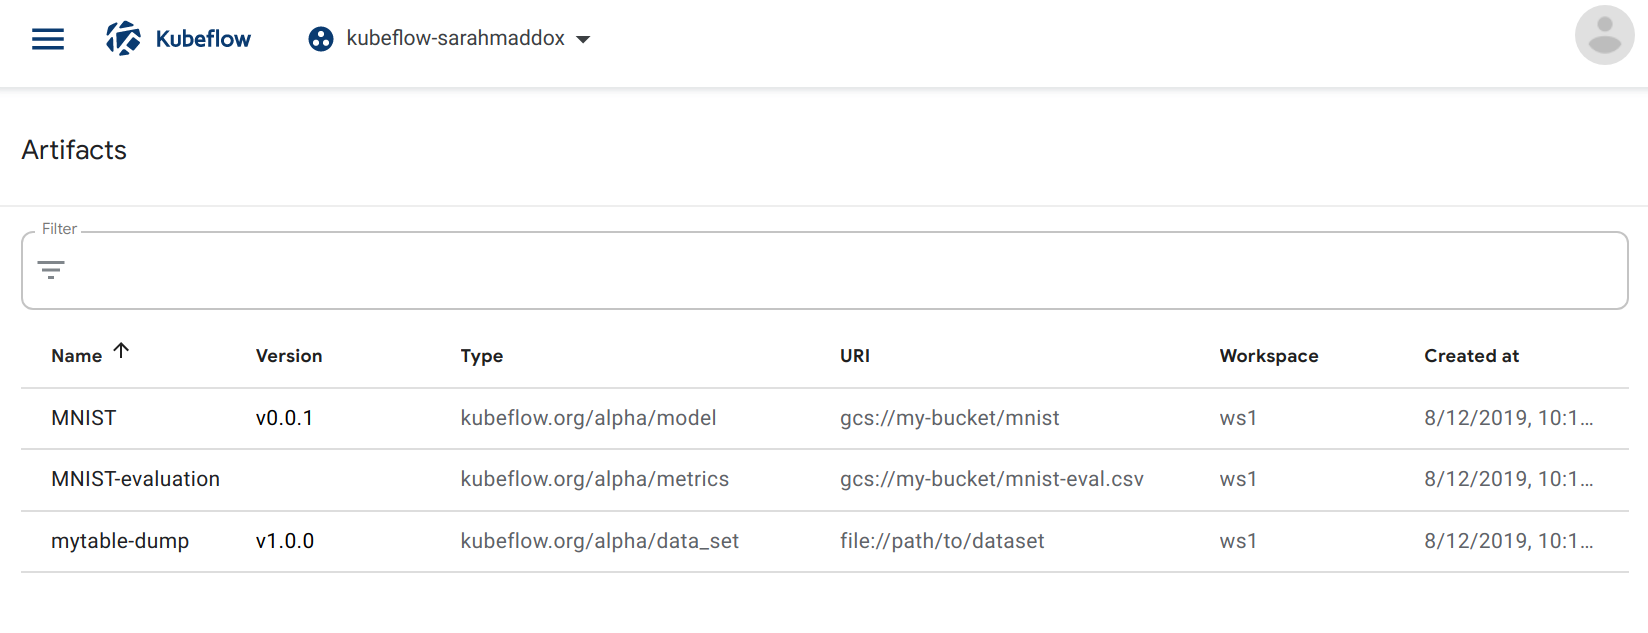
-
Example of model metadata with the name “MNIST”:
<img src="/docs/images/metadata-model.png" alt="Model metadata for an example MNIST model" class="mt-3 mb-3 border border-info rounded"> -
Example of metrics metadata with the name “MNIST-evaluation”:
<img src="/docs/images/metadata-metrics.png" alt="Metrics metadata for an evaluation of an MNIST model" class="mt-3 mb-3 border border-info rounded"> -
Example of dataset metadata with the name “mytable-dump”:
<img src="/docs/images/metadata-dataset.png"
  alt="Dataset metadata"
  class="mt-3 mb-3 border border-info rounded">
GRPC backend
The Kubeflow metadata deploys the gRPC service of ML Metadata (MLMD) to manage the metadata and relationships.
Kubeflow Metadata SDK saves and retrieves data via the gRPC service. Similarly, you can define your own metadata types to log and view metadata for your custom artifacts. For Python examples, you can check MLMD Python client and Kubeflow Metadata SDK source code. For Go examples, you can check the source code of the metadata watcher.
Next steps
Run the xgboost-synthetic notebook to build, train, and deploy an XGBoost model using Kubeflow Fairing and Kubeflow Pipelines with synthetic data. Examine the metadata output after running through the steps in the notebook.
Feedback
Was this page helpful?
Glad to hear it! Please tell us how we can improve.
Sorry to hear that. Please tell us how we can improve.